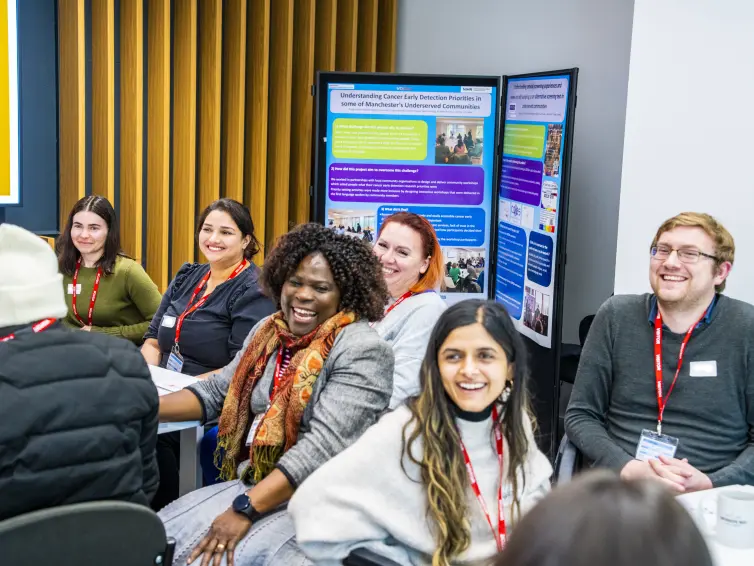
The people we work with
Vocal’s community of public contributors, people who take part in our activities, has grown from 238 in 2017 to over 1000 in December 2022.
The importance of diversity in health research is more urgent than ever, especially since the COVID-19 pandemic, but there are still no requirements to collect demographic data about who is involved in research, or who takes part in clinical trials.
We prioritise diversity and inclusion in our work and want to understand who is involved in our work and who isn’t. We invite people to provide information about themselves, including their protected characteristics as defined by the Equalities Act 2010. People don’t have to share this information with us and they can still join in without providing it.
Here we present key data* that people have provided between May 2021 & November 2022. This shows that the people we work with come from a wide range of backgrounds and enables us to see who isn't well represented so far and to focus our efforts on involving them.
Gender
Over 70% of public contributors said they are female, compared to 28% who said they are male, 0.1% said they are non-binary and 0.4% preferred to self-define.
Age & sexuality

Disability
30% of Vocal's public contributors said that they had a physical or mental impairment that has a substantial and long-term adverse effect on their ability to carry out normal day to day activity, as defined by the Equalities Act 2010.
Ethnicity
Our data collection form uses the same categories for people's ethnic groups that are used in the UK Census.

Location

Next steps
We want to involve more men, more people from ethnic minority backgrounds who aren't well represented currently, more people with disabilities and more LGBT+ people in our work. We also want to increase representation of people from areas in Greater Manchester where the numbers are currently low.
If you’d like to work with us to increase representation of people having a say in health research please get in touch.
*Important information
This is a snapshot of data that people have provided since May 2021. Please note that not all people respond to all the questions and that percentages have been rounded-sm up or down to the nearest whole number, for the purposes of clarity. For more detail please see our peer-reviewed paper which outlines our approach in more depth and analyses data which we collected between December 2018 and March 2022.